AI-FORM Case Study
Case Study I: Stamping Optimization of Oil Panel
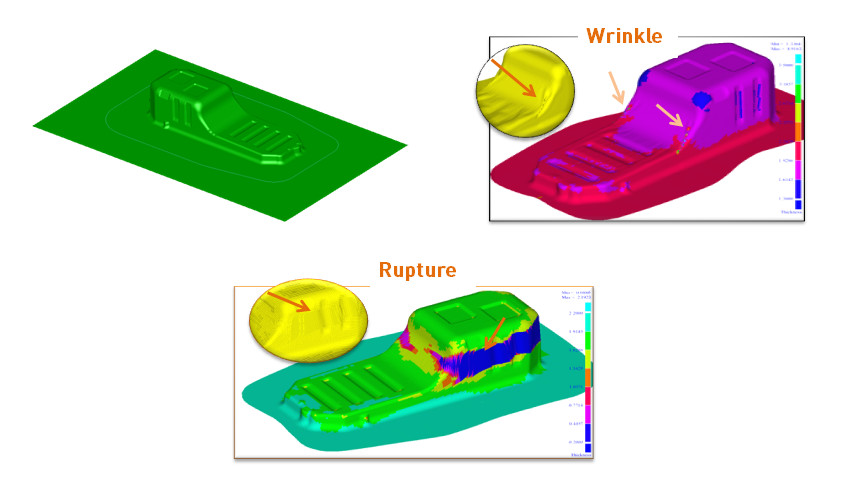
The initial simulation result - Serious wrinkle and crack existed in the oil panel
Project Background
- The oil panel part has a complex shape, uneven drawing depth and big saddle feature on parts, so that it is very easy to cause wrinkle and crack during the stamping process. It is necessary to optimize the initial blank sheet size, holding force, drawbead shape and dimension to balance the material flow and avoid defects.
- The traditional method is combining different conditions for CAE simulation and choose the best one. But this method takes a long time and it has a low efficiency,hence it is quite difficult to find the best solution. Hence the fully integrated automatic optimization is required to solve this problem.
Optimization Strategy
According to the initial simulation, in order to find the best working window, the following geometry parameters and process variables were selected:
- The dimension of the blank sheet (offset of BS in the figure below)
- The location and length of drawbead (DB1 and DB2)
- The drawbead restrain force during drawing which can could be used to define the shape and dimension.
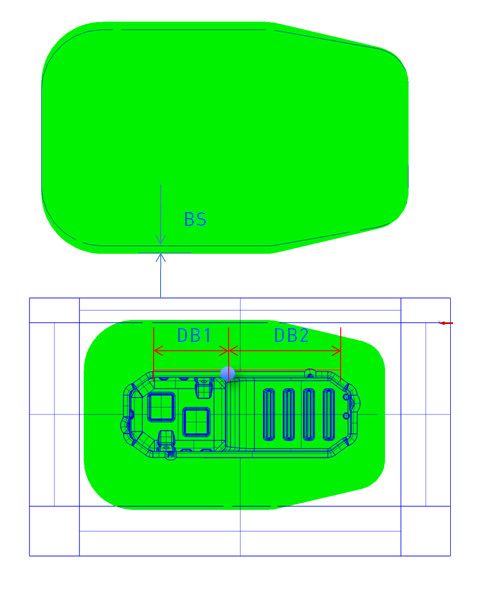
Schematic diagram of input parameters
Optimization Criteria
The objective is defined as follows:
- Select an area in the saddle region and check the maximum thickness (to detect the wrinkles).
- Put a sensor on the blank sheet to check the metal flow.
- The region at the top of the part is used to calculate the cumulative value of the FLD which then determine whether the rupture occurs or not.
Optimization Phases
Due to the relationship between input variables and output results were not fully understood well, and the suitable working window was not clear, so we carried out the optimization analysis by the following two phases.
Phase I: Use DOE to Find the Feasible Process Window
Phase II: Use PSO to Seek the Best Process Window
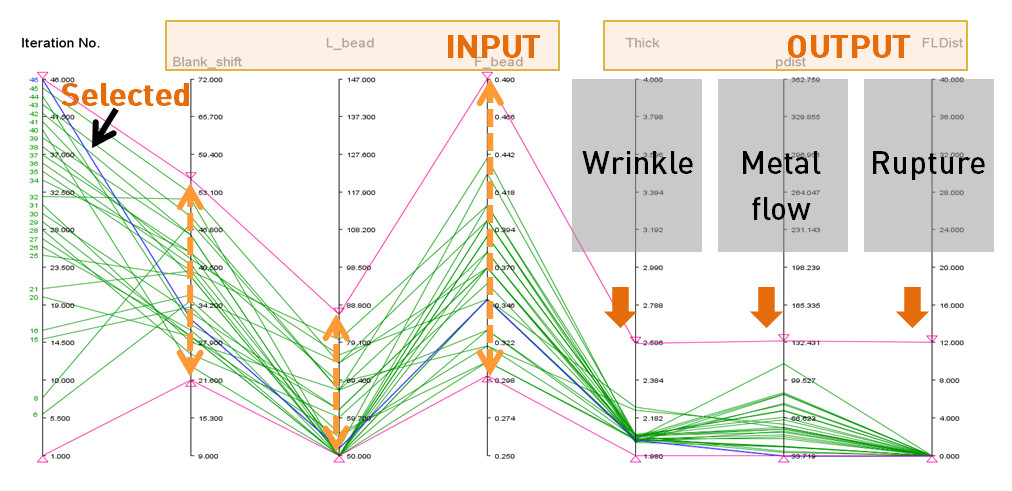
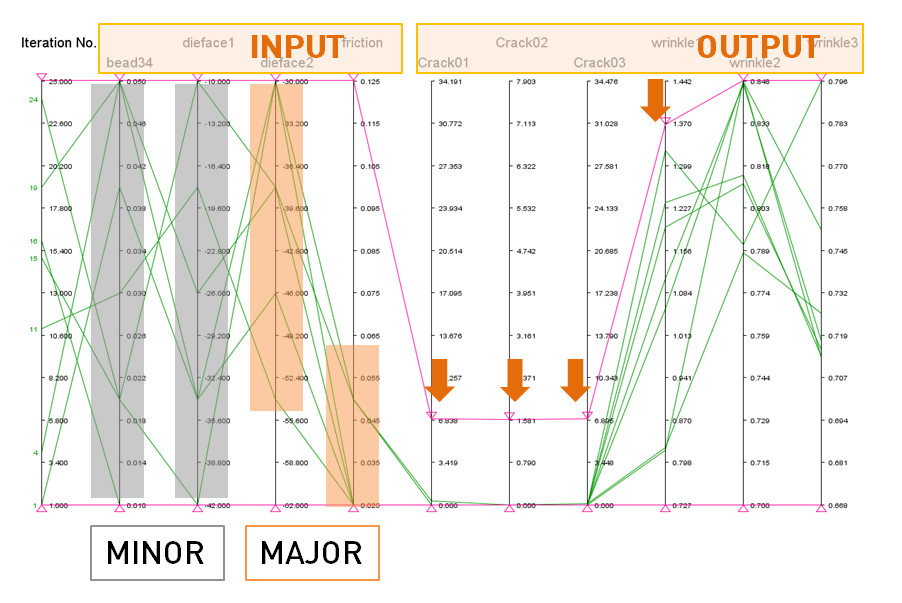
The PSO analysis results in the parallel coordinates plot
The simulation results within the optimized working window
(PSO run result of no. 46)
By adjusting the output axis, it is easy to find that if the blank sheet offset size is between 21~63mm, the drawbead length is between 50~89mm, and the drawbead resistance force coefficient is between 0.29~0.4, then the stamping result was satisfying.
Project Summary
- CAD driven automatic optimization.
- Optimize to any dimension and any parameters (geometry, material, process condition etc).
- Fully automatic meshing and FEM setup technology, all simulation results can be used for optimization criteria.
- No limitations for input and output parameters.
- DOE, GA and PSO method.
- Professional tool to analysis optimization result, i.e. Pareto front point, parallel coordinator plot, etc.
- Parallel simulation and parallel optimization.
Case study II: CAD driven optimization for cracking
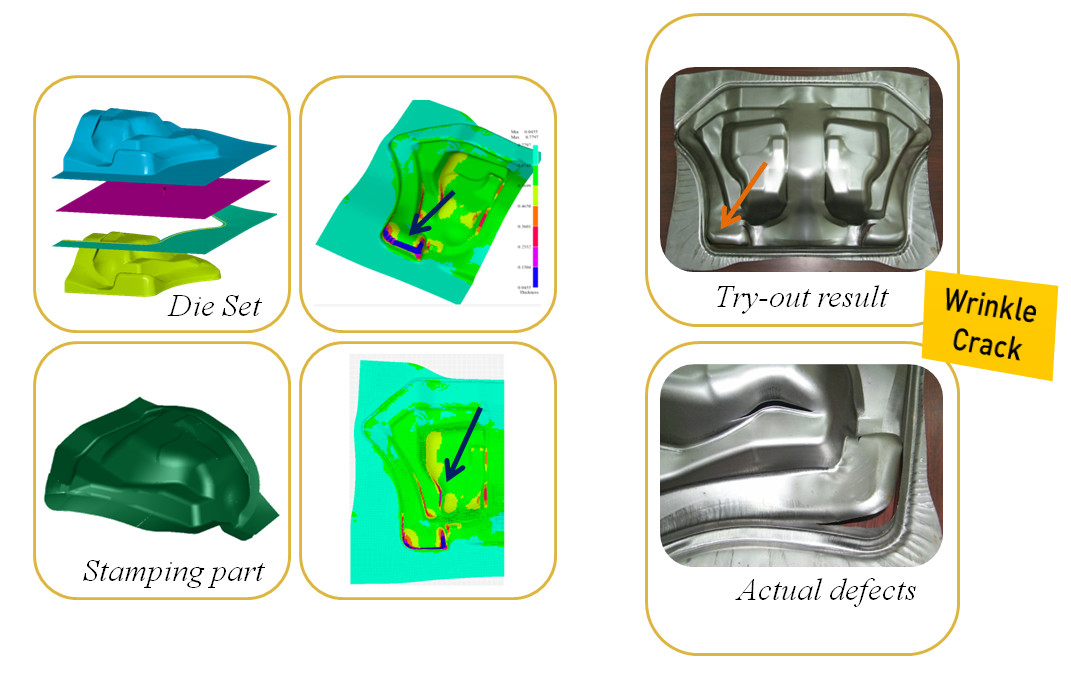
Initial design: The simulation result and try-out result
Project Background
- The formability of the stamping part is often limited by its geometric features, however, if the forming feature is far away from the region of the entrance, the difficulty level of forming is usually very high.
- To balance the wrinkles and rupture of the stamping process, there exists one very smart solution. And the solution is to store material as much as possible in the holding stage by modifying the die surface.
- In this example, CAD-driven optimization is the key technology.
- There exists one problem due to the limitations of non-linearity and without AI; the limited tradition number of manual modifications is very difficult to solve.
Optimization Phases
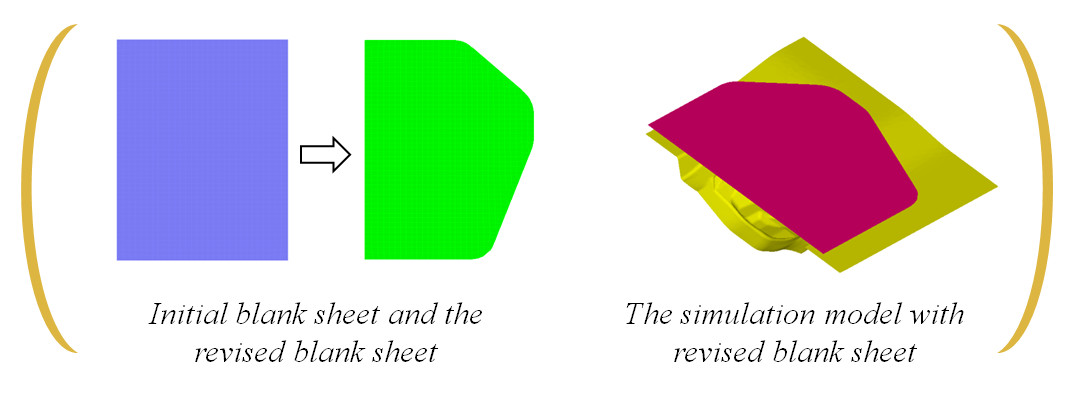
1, Improving Blank Shape and Size
2, DOE to Understand the Physical Problem
- Use the ParaCAD function to rebuild the binder and addendum surface. And make a parametric design for the key dimension H1 and H2.
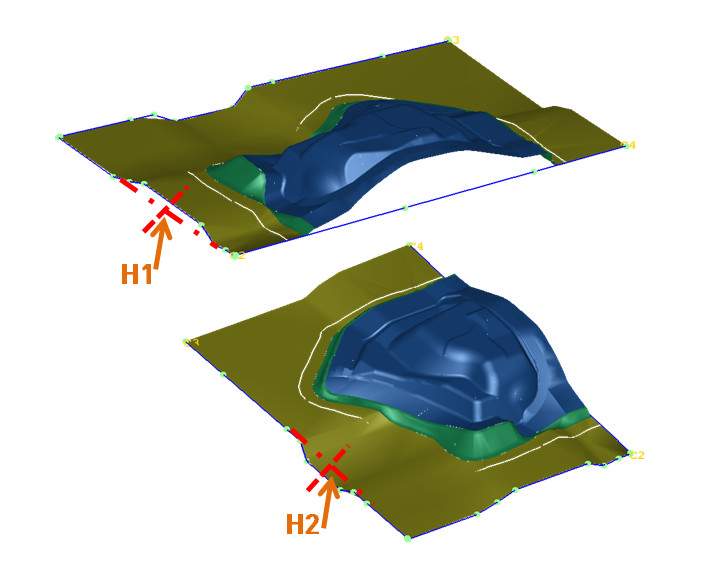
ParaCAD model for die face
- Optimized the process parameters – Friction factor, Drawbead force.
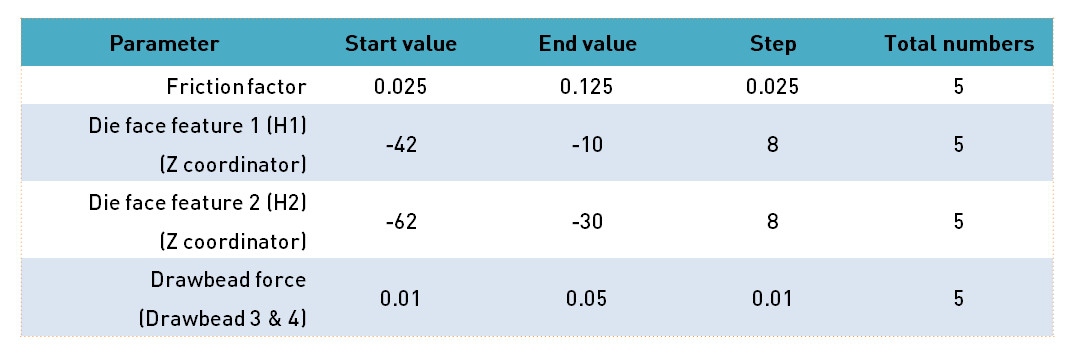
3, The Best Working Window
H2 and friction factor are the major factors as well as the H1 and drawbead resistance force are the minor factors.
From the analysis result, within the following working windows, the stamping part is safe and quality satisfied.
- Friction factor: 0.04 to 0.05
- H2: -55.0 to 30.0
- H1: -42 to -10
- Drawbead force: 0.01 to 0.05
The figure shows the proportion of influence of each variable
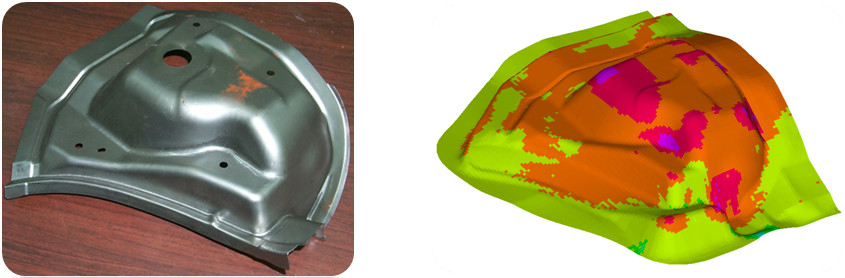
The final result of mass production and simulation
(The contour was thickness distribution)